Learn About Louisville Trees
The following provides some initial information on trees in Louisville. More information, charts and findings will be added as the UFMP project progresses.

Louisville Metro Government manages trees along streets in public rights-of-way, in parks, and other public lands. You can learn more about how Louisville's public trees are managed here.
However, the vast majority of Louisville's trees (72%) are primarily on privately owned land. While there are some regulations in place for trees when a property gets developed (and these regulations will be reviewed as part of the UFMP process), generally trees on private land are the responsibility of property owners.
This is why it is essential that the community understands the critical role that trees play in public health, equity, adapting to climate change, and many other important services. Learn more about why trees are so important and the services they provide.
|
What is tree canopy cover? How is it measured? The amount of tree canopy in a community is measured from aerial imagery, and described in a "percent of land covered" number. Tree canopy data is collected through a urban tree canopy (UTC) assessment. This is a computer-based analysis of the amount of covered by five land cover types - Trees, Low Vegetation (grass, shrubs), Impervious Surfaces (roads, buildings, etc.), Water and Bare Soil (usually agriculture fields or construction areas).
Decline in tree canopy between 2004 and 2012. In 2015, an Urban Tree Canopy (UTC) analysis was performed to determine the distribution of Louisville's tree canopy cover. The UTC showed that Louisville's tree canopy was experiencing a steady decline. It also showed that the tree canopy was unevenly distributed throughout the city. This is partly because of circumstances beyond the city's control, such as the location of the airport, but also partly an issue of equity.
Response to decline in tree canopy. Since the study was released, there has been significant efforts by TreesLouisville and other community partners in tree planting resulted in thousands of new trees going in the ground. Tree canopy cover starting to rebound. In 2022, an updated UTC analysis showed that these efforts paid off. Between the years of 2012 and 2019, Louisville's overall canopy cover grew by 1%, from 38% to the current 39% coverage. Additionally, street tree canopy grew by 2% during this time. These numbers indicate that planting efforts are strong, and trees are performing well, growing and providing increased canopy cover and the benefits that come along with it. Tree canopy cover is still inequitable. Overall tree canopy is only part of the picture, however. Tree canopy has an impactful role on public health, lowering heat levels, providing cleaner air, and better water quality in areas where it is higher. Is canopy equitably distributed in Louisville?
While overall canopy went up during the study period, certain areas of Louisville lost canopy during that time, mostly in heavily urbanized areas and on private land. Additionally, this loss correlates with socioeconomic factors with more loss recognized in areas of vulnerability, making tree canopy a social equity issue. Work is needed to understand this loss and develop methods to respond to and reverse the loss of canopy in these areas. |
|
The 2022 plan highlighted the need to:
Louisville's Trees and Heat |
|
Louisville has recognized that climate change and the urban heat island effect are increasingly impacting residents and the quality of life in their community. Several studies have been conducted to examine and address this issue, and trees and canopy cover are an effective and necessary tool to mitigate these issues.
Louisville Metro's Sustain Louisville Plan created in 2013 recognized the impact of climate change and the urban heat island effect as issues of concern, and that expanding the urban tree canopy was an important strategy to meet goals to mitigate these impacts.
According to a 2017 Health Equity Report performed for Louisville, asthma was identified as the leading cause of death for children under ten. With significantly higher temperatures, the urban heat island effect can lead to higher levels of air pollution and air quality problems that are known to trigger asthma attacks.
A 2016 Heat Management Study recognized rising temperatures and the urban heat island as a community risk, especially for the very young and old in Louisville's urban areas, and recommended several greening strategies to reduce this risk. It further recognized that while all green infrastructure was important for reducing heat related deaths and supporting public health, trees specifically outperform other vegetation, noting that in addition to the cooling effect of evapotranspiration (releasing water into the air), trees further provide cooling shade that has a significant impact on lowering temperatures.
Louisville's Canopy Coverage by Neighborhood
What does the tree canopy coverage look like in your neighborhood? As discussed above, while Louisville has improved its average tree canopy coverage city-wide, some areas of Louisville have lost canopy. It is important to examine canopy coverage where people live, as trees play such an impactful role in Louisville, lowering heat levels, providing cleaner air, better water quality and better human health. Learn more about why trees are so important and the services they provide.
Tree canopy cover in Louisville neighborhoods ranges from 13% to 66%. Of the 25 neighborhoods in Louisville, 22 neighborhoods fall below the city-wide average of 39%.
Tree canopy cover in Louisville neighborhoods ranges from 13% to 66%. Of the 25 neighborhoods in Louisville, 22 neighborhoods fall below the city-wide average of 39%.
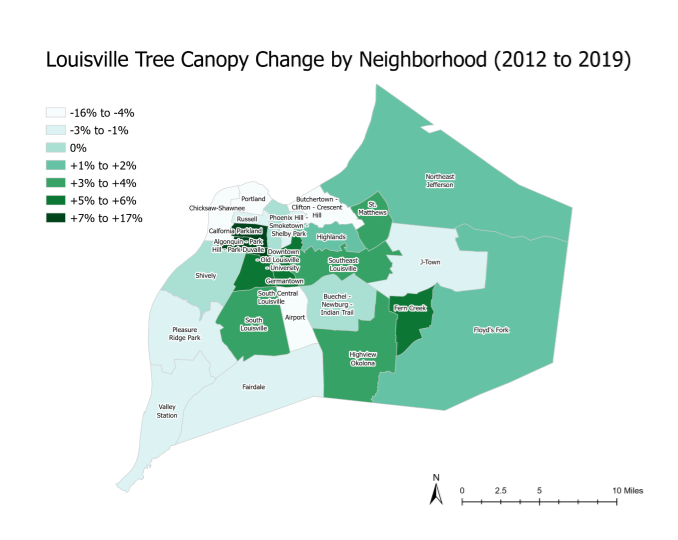
Change in Tree Canopy. Knowing that the average tree canopy coverage city-wide has increased slightly between 2012 and 2019, we can examine tree canopy change in neighborhoods over the same course of time to see how this compares to the city-wide average.
Tree canopy gains occurred in 14 of Louisville's neighborhoods, while tree canopy losses occurred in 11 neighborhoods.
Tree canopy gains occurred in 14 of Louisville's neighborhoods, while tree canopy losses occurred in 11 neighborhoods.

How much tree canopy does your neighborhood have, and how has it changed? The entire city of Louisville has been measured for the amount of land in five categories:
Click on the chart at right for a readable table (PDF) of land cover by 25 of Louisville's neighborhoods. How much tree canopy coverage does your neighborhood have, and how has it changed? Is there opportunity to plant more trees, or eliminate unused impervious surfacing (empty parking lots, vacant lots, etc.) to find more space where trees could be planted?
- Tree Canopy Cover
- Low Vegetation (everything green except trees - lawn, shrubs, fields, etc.)
- Impervious Surfaces (hard surfaces that repels rain - roads, buildings, parking lots, etc.)
- Water (lakes, streams, rivers)
- Bare Soil (usually construction sites, empty agricultural fields, quarries, etc.)
Click on the chart at right for a readable table (PDF) of land cover by 25 of Louisville's neighborhoods. How much tree canopy coverage does your neighborhood have, and how has it changed? Is there opportunity to plant more trees, or eliminate unused impervious surfacing (empty parking lots, vacant lots, etc.) to find more space where trees could be planted?
Louisville's Tree Cover and Equity
We understand now that trees have a significant impact on public health and wellbeing, and that the benefits that trees provide need to be available to all Louisville residents where they live. Currently, there are drastic differences in canopy coverage by neighborhood throughout the city. Examining historic redlining areas and comparing canopy coverages between areas that were redlined and areas that were not can provide some insight into how this practice has affected tree canopy coverage over time.
You can read more about redlining at Louisville's Lojic website here.
According to Lojic, redlining refers to the practice of denying loans in certain neighborhoods because of socioeconomic characteristics rather than physical, design, or structural characteristics. Throughout the early 20th century, the Federal Government put a series of policies into place to enforce racial capitalism and racial banishment that effectively locked Black communities out of wealth access and produced an uneven housing market that systematically excludes and dispossesses Black people from stable and secure housing.
The chart below right shows percent canopy in each HOLC (Homeowner's Loan Corporation) district, each dot represents a neighborhood*. These maps assigned grades 'A' through 'D' to neighborhoods to indicate their 'desirability' for investment in infrastructure and financial benefits such as mortgage insurance and mortgage loans. Black, immigrant, and low-income neighborhoods were often given grades of 'C' or 'D,' eliminating their access to mortgage insurance or credit for decades. The chart below shows that the neighborhoods in the A category match or exceed the city-wide average of 39%, most having at least 40% canopy coverage or more. The rating categories C and D have tree canopy covers that go as low as 5%. More analysis is planned.


